
Service quality: bandwidth, latency, jitter, and ping

The text introduces the concept of Quality of Service (QoS), explaining the difference between a connection’s theoretical capacity and its actual performance. It then presents fundamental concepts such as bandwidth, throughput, latency, RTT, and jitter.

The lesson also describes the role of buffers and jitter buffers, which are used to compensate for irregularities in data reception—particularly in streaming and real-time communications.

The final section explains why different types of media require different levels of Quality of Service: text and images are less time-sensitive, whereas video calls, live streaming, and online gaming require low latency and continuous data flow. Finally, the “ping” command is introduced as a tool for verifying host reachability and measuring response time.

Quality of Service

In networking, the term quality of service, or simply QoS (from the English Quality of Service), is used to refer either to the parameters used to characterize the quality of the service provided by the network (for example, speed, packet loss, delay, etc.) or to the tools and techniques used to achieve a desired quality of service (Blake et al., 1998; International Telecommunication Union [ITU], 2011).

Below is a list of the main attributes used to define the quality of a network connection.

Bandwidth

Bandwidth, in computing, refers to the amount of data that can be transferred from one point to another in a given period of time (Chimento & Ishac, 2008).

Bandwidth=\frac{Amount\;of\; information}{Transfer\;time}

Bandwidth is measured in bits per second (bps). The bit rate is the number of bits transferred in one second. Its most common multiples are kilobits per second (Kbps, one thousand bits per second), megabits per second (Mbps, one million bits per second), and gigabits per second (Gbps, one billion bits per second) (Chimento & Ishac, 2008).

Bandwidth can refer to different links. For example, it can indicate the capacity of a local network link or that of the last mile, that is, the link that connects the user’s network to the ISP’s network (Chimento & Ishac, 2008).

When we talk about the “Internet speed” of a home connection, we normally mean the bandwidth available on the last mile.

In networking terminology, the term bandwidth is often used to indicate the theoretical maximum data transfer capacity of a connection, measured in bits per second (Chimento & Ishac, 2008).
In this context, describing a connection as 100 Mbps means that, under ideal conditions, it can transfer up to 100 million bits per second.

This speed can vary depending on the following factors (Chimento & Ishac, 2008; Constantine et al., 2011):

  • Access technology, such as DSL, FTTC, FTTH, mobile networks, or satellite.
  • Communication standard used, which determines the maximum supported capacity (Ethernet 100BASE-TX, Gigabit Ethernet, VDSL2, etc.).
  • Characteristics of the transmission medium, such as copper, optical fiber, or radio waves.
  • Physical quality and length of the link, which are particularly relevant for copper connections.
  • Profile configured by the ISP, which determines the maximum bandwidth specified by the contract.
  • Capacity of the equipment and network interfaces used along the link.

Bandwidth can be symmetric or asymmetric (Constantine et al., 2011):

  • Symmetric bandwidth means that the download speed (downstream, the data transfer rate from the server to the client) and upload speed (upstream, the data transfer rate from the client to the server) are the same.
  • Asymmetric bandwidth, by contrast, has different download and upload speeds.

Many residential ISPs offer asymmetric connections, with higher download speeds than upload speeds. This is because, statistically, users tend to download content from the Internet more often than they upload new content (Constantine et al., 2011).

Example
The ADSL acronym stands for Asymmetric Digital Subscriber Line. This connection technology is asymmetric because downstream bandwidth is greater than upstream bandwidth.

Another important concept is throughput (Constantine et al., 2011).

Throughput is the actual amount of data transferred over a given period of time. Unlike theoretical bandwidth, throughput takes into account real network conditions, such as congestion, interference, distance, signal quality, packet loss, and traffic generated by other users (Constantine et al., 2011).

Therefore, throughput is always lower than bandwidth or, at most, equal to it (Chimento & Ishac, 2008; Constantine et al., 2011).

Throughput can depend on the following factors (Chimento & Ishac, 2008; Constantine et al., 2011):

  • Available bandwidth on the slowest link traversed by the data.
  • Network congestion caused by a large number of users or high traffic levels.
  • Time and control data required for protocols to operate, for example to establish a connection, acknowledge received data, and handle errors.
  • Packet loss or corruption, which may require retransmissions (Constantine et al., 2011).
  • Protocol overhead, because part of the transmitted data consists of headers and control information (Chimento & Ishac, 2008; Constantine et al., 2011).
  • Quality of the local network, including coverage, interference, and distance from the Wi-Fi access point.
  • Performance of modems, routers, devices, and network interfaces.
  • Capacity of the server or remote service sending or receiving the data.
  • Number of applications and devices using the connection at the same time.
  • ISP traffic management policies, such as limitations, priorities, and traffic-shaping mechanisms (Constantine et al., 2011).

Example
I need to download a 20 MB file (one byte equals 8 bits), and it takes 20 minutes.

\begin{aligned}
\text{Throughput}
&= \frac{20\,\mathrm{MB}}{20\,\mathrm{min}} \\[1em]
&= \frac{20\,000\,000\,\mathrm{B}}
        {20 \cdot 60\,\mathrm{s}} \\[1em]
&= \frac{20\,000\,000 \cdot 8\,\mathrm{b}}
        {20 \cdot 60\,\mathrm{s}} \\[1em]
&= \frac{160\,000\,000\,\mathrm{b}}
        {1\,200\,\mathrm{s}} \\[1em]
&= 133\,333\,\mathrm{bps}
 \approx 133\,\mathrm{kbps}
\end{aligned}

Bandwidth can be used to calculate the theoretical minimum transfer time for content of a given size in bytes (Chimento & Ishac, 2008).
Consider the inverse bandwidth formula:

transfer\;time=\frac{Amount\;of\;information}{Bandwidth}

Example
Suppose we want to transfer a 10 MB (10 megabyte) file to a device with a bandwidth of 5 Mbit/s.
The transfer time will be given by:

\begin{aligned}
\text{transfer time}
&= \frac{10\,\mathrm{MB}}{5\,\mathrm{Mbps}} \\[1em]
&= \frac{10\,000\,000 \cdot 8\,\mathrm{b}}
        {5\,000\,000\,\mathrm{bps}} \\[1em]
&= \frac{80\,000\,000\,\mathrm{b}}
        {5\,000\,000\,\mathrm{bps}} \\[1em]
&= 16\,\mathrm{s}
\end{aligned}

Latency

Latency (also called latency time) is the time between sending a packet, request, or signal and its reception or response by the destination: it represents the delay between the start of an action and its actual execution or response (ITU, 2019; Almes et al., 1999).
Latency is measured in milliseconds (ms) and is affected by several factors within a network. Some of the main factors that contribute to latency include (ITU, 2019; Almes et al., 1999):

  • Connection speed: a faster Internet connection tends to reduce latency because data packets are transmitted more quickly.
  • Physical distance: latency increases with the physical distance between the source and destination of the data. For example, long-distance connections, such as those between continents, may have higher latency (Almes et al., 1999).
  • Network congestion: when a network is overloaded with traffic, packets may be delayed while being routed to the intended destination (ITU, 2019; Morton & Claise, 2009).
  • Infrastructure quality: the quality and reliability of routers, cables, and other network components can affect overall latency.
  • Network protocols: some network protocols are more efficient than others and can reduce latency.

It is important to emphasize that bandwidth and latency are not the same thing (ITU, 2019; Constantine et al., 2011).
A connection with high bandwidth can transfer large amounts of data per second, but it does not necessarily have low latency.
Latency also depends on physical distance, the path followed by packets, congestion, and processing times in network devices.
Latency can have a significant impact on many activities, especially applications that require fast response times, such as online games or video calls (International Telecommunication Union [ITU], 2003; ITU, 2011).
For example, high latency in online games can cause a delay between the user’s action and the game’s response, negatively affecting the gaming experience.
In general, low latency is preferable, especially for real-time applications, because it allows the network to operate more smoothly and responsively.
Network operators and network engineers constantly seek to improve latency by optimizing infrastructure, implementing advanced technologies, and using efficient protocols.

Example
A connection with latency around 15–30 ms can feel very responsive for online games. By contrast, latency of 80–100 ms is still usable, but it can make delay more noticeable in real-time applications.

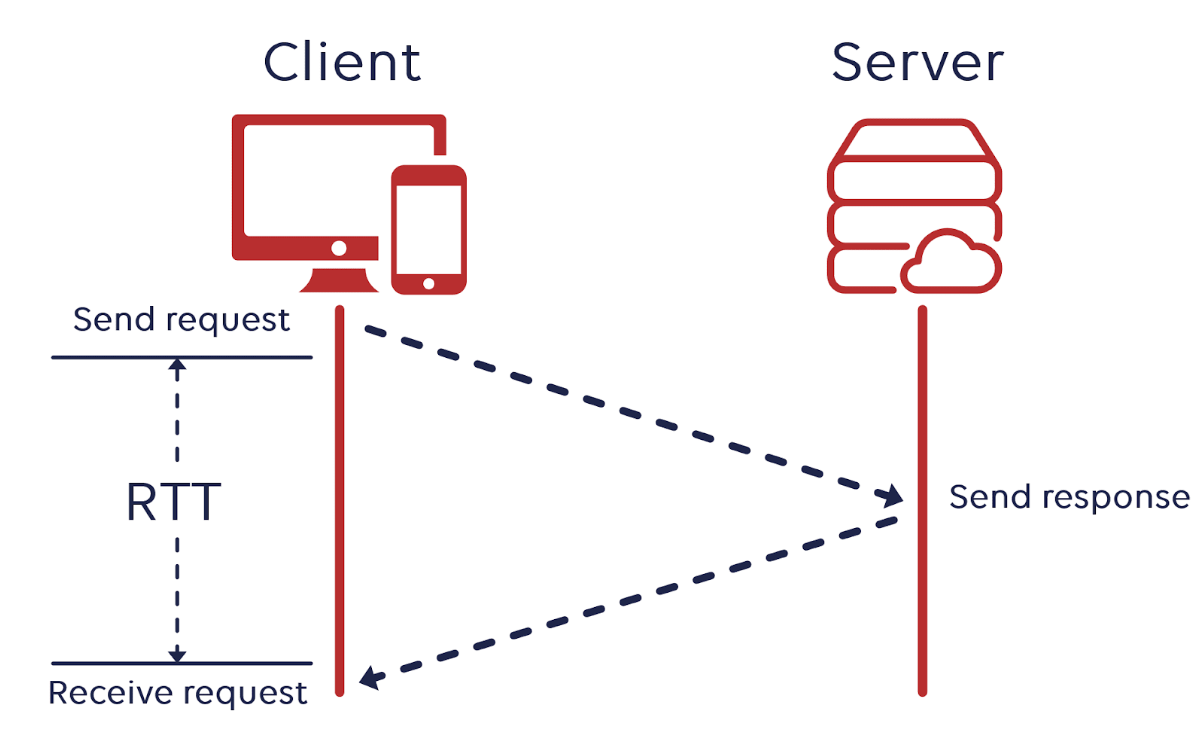
Round Trip Time (RTT, round-trip time) is a measure related to latency: it is the time between sending a packet to a destination and receiving the corresponding response back at the sender (Almes et al., 1999).
In other words, RTT is the total time required to complete a round trip between two points in a network connection.
In an ideal, symmetric network, RTT can be considered approximately twice the one-way latency, because it includes both the time needed to reach the destination and the time needed to receive the response. In real networks, however, this relationship is not always exact because the outbound and return paths can have different delays (Almes et al., 1999).
Jitter

Jitter is another important concept that is particularly relevant to real-time applications, such as voice calls over the Internet or videoconferencing (Schulzrinne et al., 2003; Demichelis & Chimento, 2002).
Jitter represents the variation in the latency of data packets as they travel from a source to a destination across the network (Demichelis & Chimento, 2002).

  • If packets arrive with very different delays, jitter is high.
  • If, on the other hand, they arrive with similar and regular delays, jitter is low.

Jitter can be problematic for real-time applications because it can cause issues such as delays in voice or image transmission during a video call (Schulzrinne et al., 2003; Morton & Claise, 2009).
If jitter is low, the packet flow is more uniform and the user experience is better, because there are fewer interruptions or synchronization problems between participants.
Jitter can have several causes, including (Morton & Claise, 2009):

  • Network congestion: when a network is overloaded with traffic, packets may be delayed or received out of sequence, causing jitter.
  • Variable network paths: if packets have to travel along different routes through the network, they may experience different latencies, contributing to jitter.
  • Queue management: in network devices, packet queue management can affect jitter. If packets accumulate in a queue that is too large or too small, their delay can vary (Morton & Claise, 2009).

To address jitter and improve the quality of real-time communications, network service providers and application developers implement various techniques, such as traffic prioritization, the use of buffers (we will examine this technique shortly), or the selection of more stable network paths, in order to reduce latency variability and maintain a regular data flow (Blake et al., 1998; Morton & Claise, 2009).
We can think of jitter as the standard deviation of latency (Demichelis & Chimento, 2002).
Standard deviation is a statistical measure that represents the dispersion or variability of a set of data relative to its mean. In other words, it indicates how much the values in a sample tend to differ from the sample mean.

Example
If the mean of a data set is 5 and the standard deviation is 0, it means that all the data values are equal to 5..

Buffer

The term buffer refers to a portion of temporary memory used to compensate for differences in speed between two devices or processes exchanging data (Morton & Claise, 2009).
In practice, the buffer accumulates data waiting to be processed or transmitted, acting as a “cushion” (hence the name) between the producer and the consumer of the data.
Imagine a tap from which water flows faster than a glass can collect it without overflowing: an intermediate container is needed.
In digital systems, that container is the buffer: temporary RAM that helps compensate for differences in speed and timing irregularities.

Example
Some practical examples of buffer use:

  • Printing: the file to be printed is buffered before being sent to the printer.
  • Networks: a router uses buffers to store incoming packets before forwarding them.
  • Digital audio: sounds recorded in real time are buffered so that they can be processed without interruptions.
  • Writing to disk: data to be saved are placed in a buffer and then written to disk.

An important use of buffers on the Internet is to limit the effects of temporary variations in data reception. For example, in video or audio streaming, the buffer preloads part of the content to prevent interruptions during playback (Morton & Claise, 2009).

When a user starts a video, for example on YouTube, Netflix, or Spotify, the system does not immediately play each piece of data as soon as it is received.
Instead, it accumulates part of the content in a local buffer, that is, temporary memory. When the buffer contains enough data, playback begins.
Meanwhile, new data continue to arrive and fill the buffer.

This process protects against temporary network slowdowns and allows smoother playback even when data do not always arrive at a regular rate.
However, if the incoming data flow remains consistently higher than the processing or playback capacity, the buffer will eventually fill up, causing waits, dropped data, or interruptions.

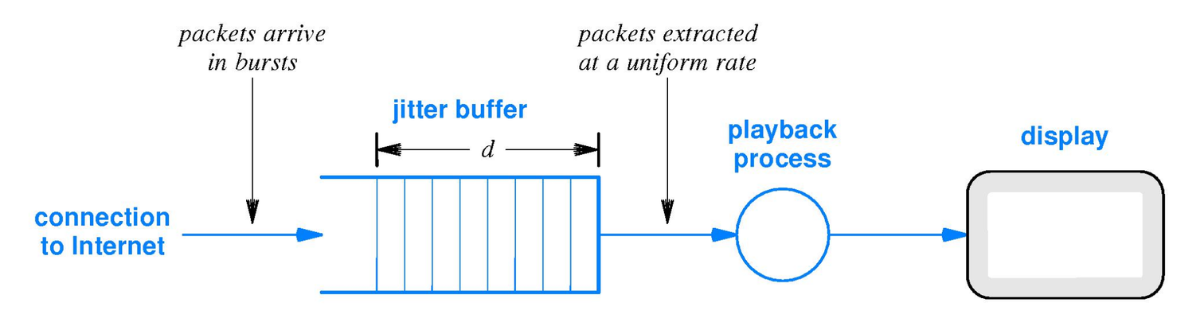
In real-time streams, such as voice calls and video calls, the more specific term jitter buffer is used (Morton & Claise, 2009).
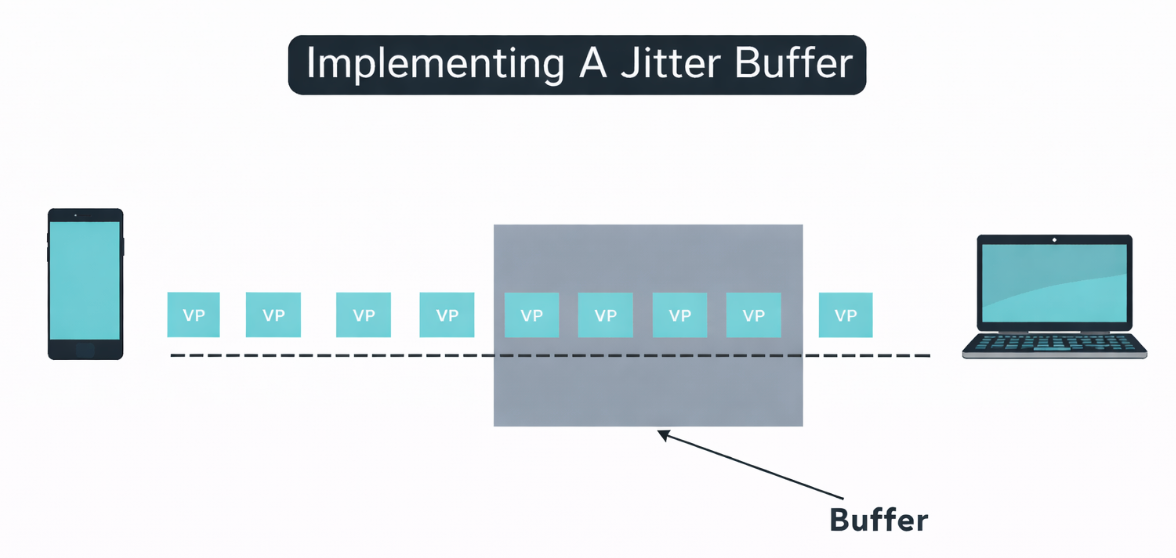
A jitter buffer is a buffer designed to compensate for variations in packet arrival times while keeping latency as low as possible (Morton & Claise, 2009).

The main difference is:
  • In traditional streaming, the system can afford to accumulate more data in advance, even if this introduces a greater delay.
  • In a video call, by contrast, the delay must remain minimal because users need to be able to interact in real time.
This diagram shows how the buffer works: it stores packets and then sends a stream with constant latency to the end device

The buffer is used to compensate for jitter and make playback more regular.

  • If jitter is high, a larger buffer is needed.
  • However, a buffer that is too large introduces latency (the system has to wait longer for the buffer to fill), so an intelligent trade-off is needed, often managed by dynamic jitter-buffer algorithms (Morton & Claise, 2009).

Quality of Service in Media

Having adequate quality of service for media playback is important because poor quality of service causes degradation of the media itself (Blake et al., 1998; ITU, 2011).
Quality of service can have different requirements depending on the type of media (ITU, 2011; Schulzrinne et al., 2003):

  • Non-continuous media: in non-continuous media, such as text and images, latency can affect the waiting time before display. However, once the data have been received, the content can be shown without having to follow a precise timing pattern.
  • Continuous media: in continuous media, such as audio and video, it is not enough for the data simply to arrive; they must also arrive regularly. An initial delay may be acceptable if the content is not interactive, because it can be compensated for with a buffer. It becomes more problematic when packets arrive with highly variable delays, because audio may be interrupted and video may stutter (Schulzrinne et al., 2003; Morton & Claise, 2009).
  • Live streaming: the content is produced and transmitted almost in real time. A buffer can be used here as well, but it cannot be too large, otherwise the user would see the event with excessive delay (ITU, 2011; Morton & Claise, 2009).
  • Real-time interactive media: in interactive applications, such as online games and video calls, delay must be even lower because the user expects an immediate response to their actions (ITU, 2003; Schulzrinne et al., 2003).

Managing quality of service for media presents four levels of difficulty, in increasing order (ITU, 2011; Schulzrinne et al., 2003):

  • Managing non-continuous media, such as images and text.
  • Managing the streaming of recorded content (stored media), such as watching a video on YouTube.
  • Streaming content produced in real time (live media), such as radio. The main problem when designing streaming and teleconferencing applications is network delay.
  • Audio and video require real-time presentation, which means that, to be useful, they must be delivered over the network at specific times.
  • Real-time interactive applications, such as video games or teleconferencing. In this case, large delays mean that calls that are supposed to be interactive are no longer truly interactive (ITU, 2003; Schulzrinne et al., 2003).

Ping

A simple way to analyze quality of service is ping (Postel, 1981; Almes et al., 1999).
Ping is a network command used to check whether a host is reachable over an IP network and to measure response time. It can also help identify packet loss by showing whether some requests receive no response (Postel, 1981; Almes et al., 1999).
The name comes from the sound of sonar on submarines: just as a sound echo checks whether something responds, ping checks whether a host responds on the Internet or on a LAN.

  • When ping is run, the computer sends a special packet to an IP address or a domain name.
  • If reachable, the destination device responds with another packet.

Ping can be entered as a command in the operating system terminal. For example, if you type:

ping google.com

The result will be:

Response from 142.250.184.14: byte=32 tempo=24ms TTL=118

Where:

  • byte = 32 → size of the packet sent.
  • time = 24 ms → time required to receive the response, that is, its RTT (Almes et al., 1999).
  • TTL = 118 → Time To Live, the number of router “hops” the packet can make before it expires (Postel, 1981).

Key points

  • Quality of service (QoS) describes network performance through parameters such as bandwidth, latency, jitter, and packet loss.
  • Bandwidth indicates the theoretical maximum amount of data that can be transferred in one second and is measured in bps.
  • Throughput is the speed actually achieved and is normally lower than theoretical bandwidth.
  • Bandwidth can be symmetric, with equal download and upload speeds, or asymmetric.
  • Latency is the delay in data transmission and is measured in milliseconds.
  • RTT indicates the time required for a packet to reach the destination and for the response to return to the sender.
  • Jitter is the variation in latency between different packets and can cause interruptions in real-time services.
  • A buffer temporarily stores data to compensate for slowdowns and irregularities in reception.
  • A larger buffer reduces interruptions but can increase latency.
  • Text and images tolerate delays better; streaming, video calls, and online games require more regular data delivery and shorter response times.
  • Ping checks whether a host is reachable and measures RTT, packet loss, and other information about the communication.

Download the lesson PDF

  • Almes, G., Kalidindi, S., & Zekauskas, M. (1999). A round-trip delay metric for IPPM (RFC 2681). RFC Editor. https://doi.org/10.17487/RFC2681
  • Blake, S., Black, D., Carlson, M., Davies, E., Wang, Z., & Weiss, W. (1998). An architecture for differentiated services (RFC 2475). RFC Editor. https://doi.org/10.17487/RFC2475
  • Chimento, P., & Ishac, J. (2008). Defining network capacity (RFC 5136). RFC Editor. https://doi.org/10.17487/RFC5136
  • Constantine, B., Forget, G., Geib, R., & Schrage, R. (2011). Framework for TCP throughput testing (RFC 6349). RFC Editor. https://doi.org/10.17487/RFC6349
  • Demichelis, C., & Chimento, P. (2002). IP packet delay variation metric for IP performance metrics (IPPM) (RFC 3393). RFC Editor. https://doi.org/10.17487/RFC3393
  • International Telecommunication Union. (2003). One-way transmission time (Recommendation ITU-T G.114). https://www.itu.int/rec/T-REC-G.114/en
  • International Telecommunication Union. (2011). Network performance objectives for IP-based services (Recommendation ITU-T Y.1541). https://www.itu.int/rec/T-REC-Y.1541/en
  • International Telecommunication Union. (2019). Internet protocol data communication service—IP packet transfer and availability performance parameters (Recommendation ITU-T Y.1540). https://www.itu.int/rec/T-REC-Y.1540/en
  • Morton, A., & Claise, B. (2009). Packet delay variation applicability statement (RFC 5481). RFC Editor. https://doi.org/10.17487/RFC5481
  • Postel, J. (1981). Internet control message protocol (RFC 792). RFC Editor. https://www.rfc-editor.org/info/rfc792/
  • Schulzrinne, H., Casner, S., Frederick, R., & Jacobson, V. (2003). RTP: A transport protocol for real-time applications (RFC 3550). RFC Editor. https://doi.org/10.17487/RFC3550
  • Andrew S. Tanenbaum, Nick Feamster, and David J. Wetherall, Computer Networks, 6th ed., Pearson, 2022 — Provides a particularly relevant treatment of Quality of Service and application QoE, traffic management, congestion control, performance monitoring, and streaming audio and video, making it a strong general reference for the concepts developed in this chapter.
  • James F. Kurose and Keith W. Ross, Computer Networking: A Top-Down Approach, 9th ed., Pearson, 2026 — Explains network delay, packet loss, queuing, end-to-end delay, and throughput, and connects these performance characteristics to modern streaming services and Internet applications.
  • Behrouz A. Forouzan, Data Communications and Networking with TCP/IP Protocol Suite, 6th ed., McGraw Hill, 2022 — Provides a broad treatment of networking performance within the TCP/IP architecture and includes dedicated material on multimedia networking, making it useful for relating bandwidth, delay, congestion, and transport behavior to audio and video services.
  • Miguel Barreiros and Peter Lundqvist, QoS-Enabled Networks: Tools and Foundations, 2nd ed., Wiley, 2016 — Focuses specifically on Quality of Service in packet networks, covering traffic classification, policing, shaping, queuing, scheduling, congestion, and practical QoS design. It is especially useful for going beyond performance measurement and studying the mechanisms used to control and prioritize traffic.
  • Jenq-Neng Hwang, Multimedia Networking: From Theory to Practice, Cambridge University Press, 2009 — Examines multimedia networking from a system-design perspective, with particular attention to Quality of Service, network delay and jitter, streaming, real-time multimedia, and the trade-offs required to deliver audio and video over packet networks.

The fastest connection is not always the best one

Two Internet connections have the following characteristics:

Connection A

  • Bandwidth: 1 Gbps.
  • Latenza media: 95 ms.

Connection B

  • Bandwidth: 200 Mbps.
  • Average latency: 18 ms.

A user must choose which connection to use for:

  • Downloading a 20 GB file.
  • Taking part in a video call.
  • Playing a competitive online video game.
  • Watching a film in streaming.

Answer the following questions:

  • Indicate which connection might be preferable for each activity and explain your reasoning.
  • Explain why greater bandwidth does not necessarily imply lower latency.
  • Identify which activities are most sensitive to latency.
  • Explain why downloading a file is influenced mainly by the amount of data that can be transferred over time.
  • Explain why, in online games, a connection with less bandwidth can still provide a better experience.
  • Use the example to explain why the quality of a connection cannot be described by a single parameter.

Theoretical bandwidth and actual throughput

A school has a connection advertised as 500 Mbps.
During a test, a 1 GB file is downloaded in 25 seconds.

Answer the following questions:

  • Convert the file size from bytes to bits.
  • Calculate the average actual throughput achieved during the download.
  • Compare the result with the theoretical bandwidth of 500 Mbps.
  • Explain why throughput can be lower than the nominal bandwidth.
  • Identify at least four factors described in the handout that can reduce actual throughput.
  • A technician claims that the connection is faulty simply because throughput does not reach exactly 500 Mbps. Evaluate the statement and explain your reasoning.
  • Explain why, under real conditions, throughput can equal bandwidth only in the ideal limiting case.

How long should it take?

A videomaker needs to upload a 6 GB video file to the cloud.
The connection is asymmetric:

  • Download: 300 Mbps.
  • Upload: 20 Mbps.

Answer the following questions:

  • Indicate which of the two speeds should be used to calculate the file upload time.
  • Convert 6 GB into bits.
  • Calculate the theoretical minimum time required to complete the upload, assuming the entire bandwidth is actually available.
  • Explain why the transfer may take longer in practice.
  • Explain what it means for the connection to be asymmetric.
  • Explain why this type of connection may be suitable for a user who consumes a lot of content but less convenient for someone who continuously uploads large video files.
  • A second provider offers a symmetric 100 Mbps connection. Explain which of the two connections might be more attractive to the videomaker and justify your choice.

Measuring delay with ping

An administrator runs the ping command to a server and obtains the following response times:
18 ms — 21 ms — 19 ms — 20 ms — 22 ms

The administrator then repeats the test and obtains:
18 ms — 90 ms — 25 ms — 140 ms — 21 ms

Answer the following questions:

  • Explain what the values in milliseconds shown by ping represent.
  • Indicate which of the two tests shows a more temporally consistent connection.
  • Explain which QoS parameter is highlighted by the large variation in times in the second test.
  • Explain why the two tests can have average latencies that are not dramatically different yet still provide very different experiences in real-time applications.
  • State what RTT represents.
  • Explain why it is not always correct to say that one-way latency is exactly half of RTT.
  • If some ping requests received no response, indicate what additional connection problem could be suspected.
  • Explain why ping is useful for analyzing a network but does not, by itself, describe the entire quality of service.

A video call that “stutters”

During a video call, packets arrive with the following delays:
30 ms — 31 ms — 29 ms — 30 ms — 32 ms

After a few minutes, the situation changes:
30 ms — 85 ms — 41 ms — 120 ms — 33 ms

The users begin to notice irregular audio and small stutters in the video.
Analyze the problem.

  • Compare the two sequences and identify which situation has higher jitter.
  • Explain why the average latency is not the only factor that matters; the amount by which individual delays differ from one another also matters.
  • Identify at least three possible causes of jitter described in the handout.
  • Explain how different paths followed by packets can produce different delays.
  • Explain how congestion and queue management in routers can increase jitter.
  • Explain why high jitter is particularly problematic for real-time audio and video.
  • Explain in what sense jitter can be interpreted as a measure of latency variability.

How large should the buffer be?

A service must handle two applications:

  • Application A: a recorded film available for streaming.
  • Application B: a video call between two people.

The network occasionally experiences variations in packet arrival times.

Answer the following questions:

  • Explain what function a buffer can perform in both applications.
  • Explain why the streaming service can afford to accumulate a relatively large amount of data before playback begins.
  • Explain why the same solution would be problematic in a video call.
  • Describe the specific function of a jitter buffer.
  • Explain what might happen if the jitter buffer were too small.
  • Explain what might happen if it were too large.
  • Suggest which of the two applications should place greater priority on smooth playback even at the cost of a longer initial delay.
  • Explain why the ideal buffer size represents a trade-off between continuity and latency.

Four media types, four different requirements

A platform must provide the following four services:

  • Displaying photographs
  • Streaming a recorded film
  • Live streaming of a match
  • Interactive videoconferencing

Order the four services from the least difficult to the most difficult to manage from a quality-of-service perspective, and answer the following questions:

  • Explain the order you chose using the criteria in the handout.
  • Explain why an image can still be displayed correctly even after some delay.
  • Explain why a recorded film can use a fairly large buffer.
  • Explain why the buffer cannot become excessively large during a live stream.
  • Explain why videoconferencing has even stricter latency requirements.
  • Identify which services are continuous media and which one is non-continuous media.
  • Explain why, for continuous media, it matters not only that data arrive, but also that they are received at a regular rate over time.
  • Identify which parameters among bandwidth, latency, and jitter you consider particularly critical for each application and justify your choices.

Diagnosing a school network

During a school day, the following problems are reported:

  • File downloads are much slower than expected.
  • Video lessons have intermittent audio.
  • In educational online games, students’ actions are registered with a noticeable delay.
  • Recorded videos work well after a few initial seconds of loading.
  • A ping to a server alternates between values of 20 ms and 150 ms.
  • A connection advertised as 1 Gbps normally achieves only 350 Mbps of actual transfer speed.

You are the network administrator and need to make an initial diagnosis.

  • Associate each problem primarily with the concepts of bandwidth, throughput, latency, jitter, or buffering.
  • Explain why the measured 350 Mbps represents throughput and not necessarily the theoretical bandwidth of the connection.
  • Explain what problem is suggested by ping values that fluctuate between 20 and 150 ms.
  • Explain why this irregularity can affect a video lesson more severely than a normal download.
  • Explain why recorded videos can continue to work well thanks to buffering.
  • Suggest at least three possible network causes to investigate based on the factors described in the handout.
  • Indicate which measurements you would perform to distinguish a bandwidth problem from a latency or jitter problem.
  • Conclude by determining whether simply increasing the connection bandwidth would necessarily solve all the problems described, and explain your reasoning.

To create these materials, I used generative artificial intelligence tools to support the writing process, particularly to improve the wording and style of the text, reorganize content, refine phrasing, and speed up certain editorial tasks.
Since I work independently on the production of these materials, I try to automate all activities that can reasonably be automated, so that I can devote more time to research, design, and content development.

However, artificial intelligence does not determine the content of the work: the selection of topics, structure, ideas, interpretations, examples, and teaching approach are developed by me. AI is therefore used primarily as a tool to support production and formal revision, while authorship and responsibility for the design and development of the content remain mine.

Unless otherwise stated, this material is licensed under the Creative Commons Attribution–NonCommercial–ShareAlike 4.0 International License (CC BY-NC-SA 4.0).

You are therefore free to share, redistribute, adapt, and create derivative works based on this material, provided that proper attribution is given, the material is not used for commercial purposes, and any modified or derivative versions are distributed under the same license.

Do you want to help me write articles like this one?


Leave a Reply

Your email address will not be published. Required fields are marked *

No responses yet

Sostieni il progetto

Tutti i materiali che condivido nascono da una convinzione molto semplice: una buona formazione non dovrebbe limitarsi a insegnare quali pulsanti premere, ma aiutare a comprendere le idee, i principi e i processi che stanno dietro agli strumenti.

Per questo dedico una parte significativa del mio tempo a studiare, organizzare e produrre contenuti gratuiti dedicati al multimedia, al design e alla comunicazione visiva. Articoli, lezioni, approfondimenti e risorse che hanno l’obiettivo di rendere accessibili argomenti spesso affrontati in modo frammentario o superficiale.

Questo lavoro richiede però tempo, ricerca e cura. Ogni guida, ogni video, ogni materiale pubblicato gratuitamente è il risultato di molte ore di studio, scrittura e revisione.
Sostenere il progetto attraverso Patreon significa permettermi di continuare a produrre contenuti educativi di qualità, mantenerli accessibili al maggior numero possibile di persone e dedicare più energie alla costruzione di una risorsa che possa essere utile a studenti, professionisti e appassionati.

Se credi che una conoscenza più profonda, rigorosa e consapevole del multimedia abbia valore, il tuo contributo non sostiene soltanto il mio lavoro: aiuta a rendere queste risorse disponibili per tutta la comunità.
Grazie per il supporto e per la fiducia.

Patreon è troppo impegnativo?

Puoi sostenermi anche con una donazione libera, senza abbonamento e senza impegno.
Anche un piccolo contributo mi aiuta a continuare a creare giochi, contenuti didattici e materiali gratuiti con più libertà.

Support the project

All the materials I share stem from a very simple conviction: good training should not be limited to teaching which buttons to press, but should help people understand the ideas, principles, and processes behind the tools.

That is why I dedicate a significant portion of my time to researching, organizing, and producing free content focused on multimedia, design, and visual communication—articles, lessons, in-depth analyses, and resources aimed at making accessible topics that are often addressed in a fragmented or superficial way.

However, this work requires time, research, and care. Every guide, video, and piece of material published for free is the result of many hours of study, writing, and revision.
Supporting the project via Patreon enables me to continue producing high-quality educational content, keep it accessible to as many people as possible, and devote more energy to building a resource that benefits students, professionals, and enthusiasts alike.

If you believe that a deeper, more rigorous, and informed understanding of multimedia is valuable, your contribution does more than just support my work: it helps make these resources available to the entire community.
Thank you for your support and trust.

Is Patreon too demanding?

You can also support me with a voluntary donation—no subscription or commitment required.

Even a small contribution helps me continue creating games, educational content, and free materials with greater freedom.